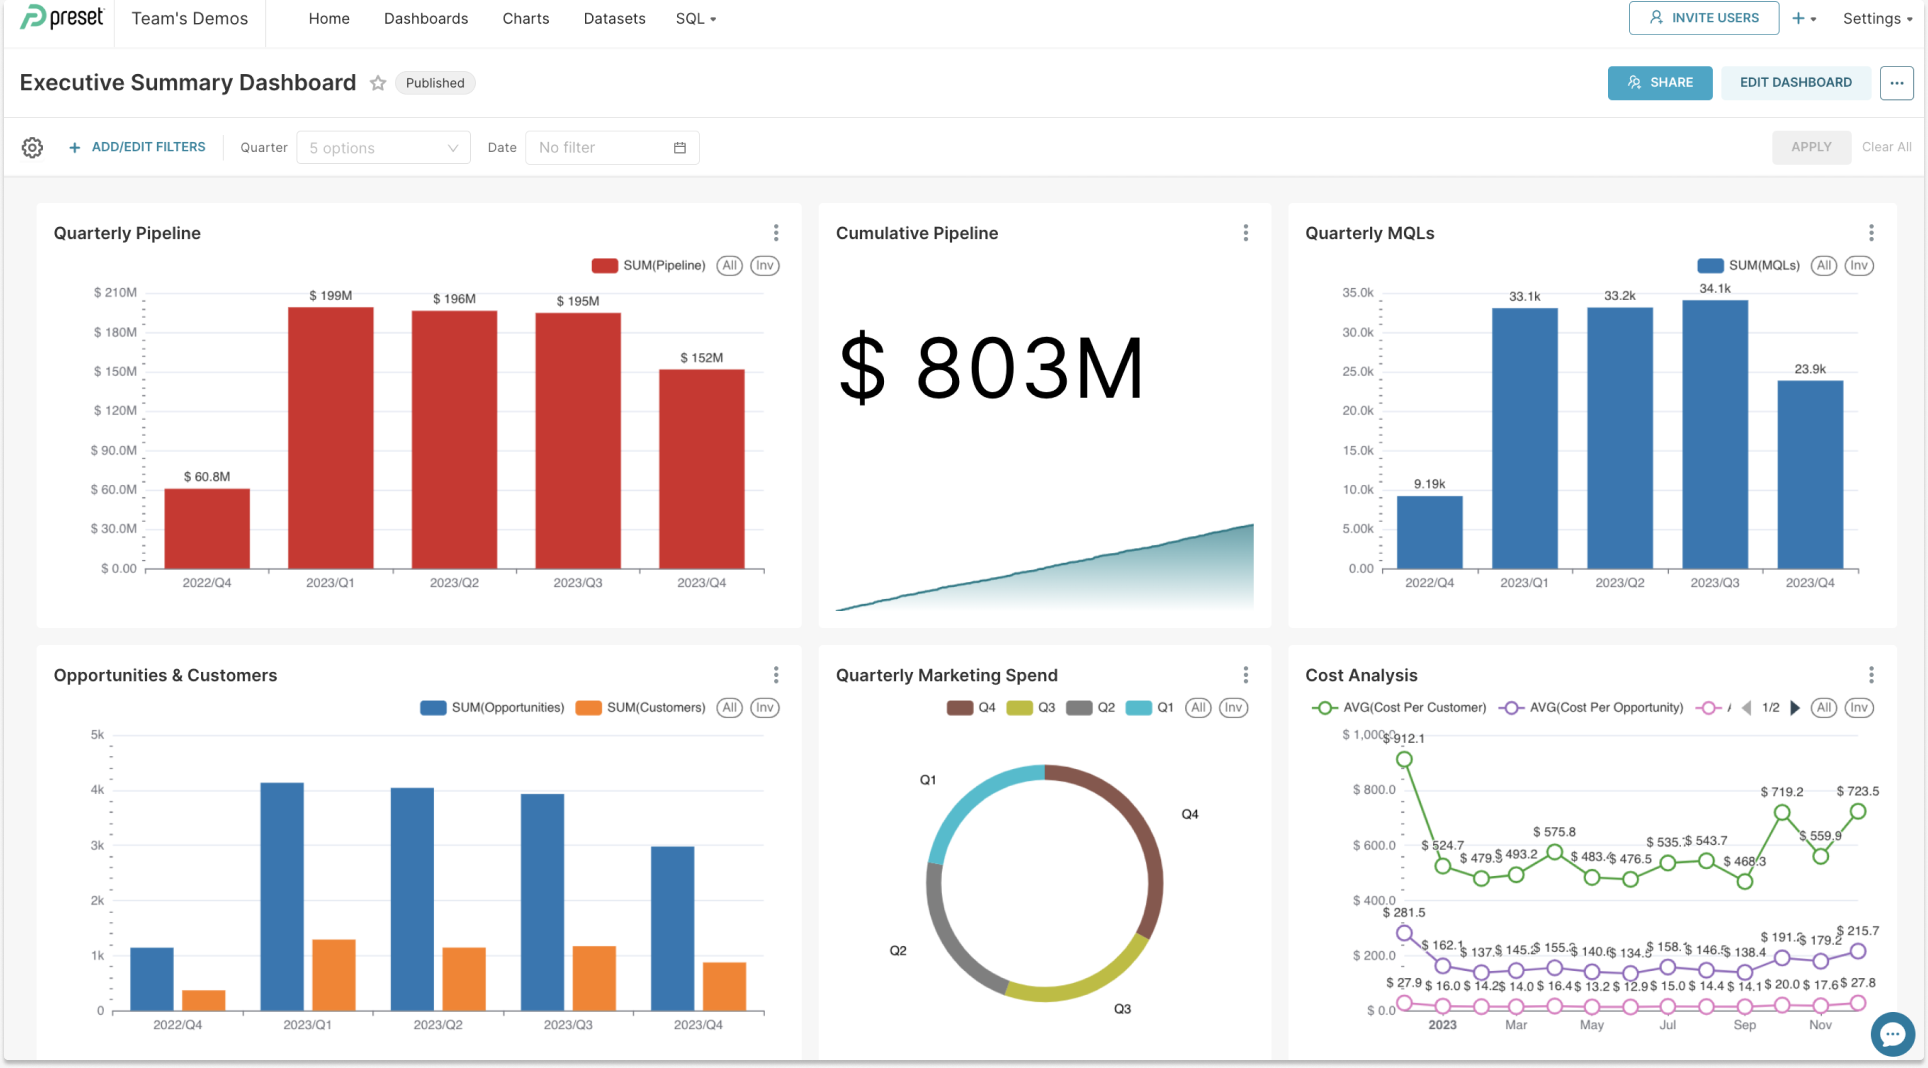
Key Analytics Dashboards for Marketing Optimization
Marketing analytics dashboards centralize KPIs from channels like web, social, ads, email, and SEO to track performance, identify trends, and optimize campaigns in real-time. Common types include CMO dashboards for high-level overviews, web analytics dashboards for site health, Google Ads dashboards for paid performance, and email marketing dashboards for campaign ROI.
Essential KPIs by Dashboard Type
Dashboards focus on actionable metrics tailored to optimization goals. Below is a breakdown of popular types with core KPIs:
| Dashboard Type | Key KPIs | Optimization Use Case | Sources |
|---|---|---|---|
| CMO/Executive | ROI, total spend, conversions, revenue attribution, pipeline contribution | Holistic view across channels for budget allocation and ROI decisions | |
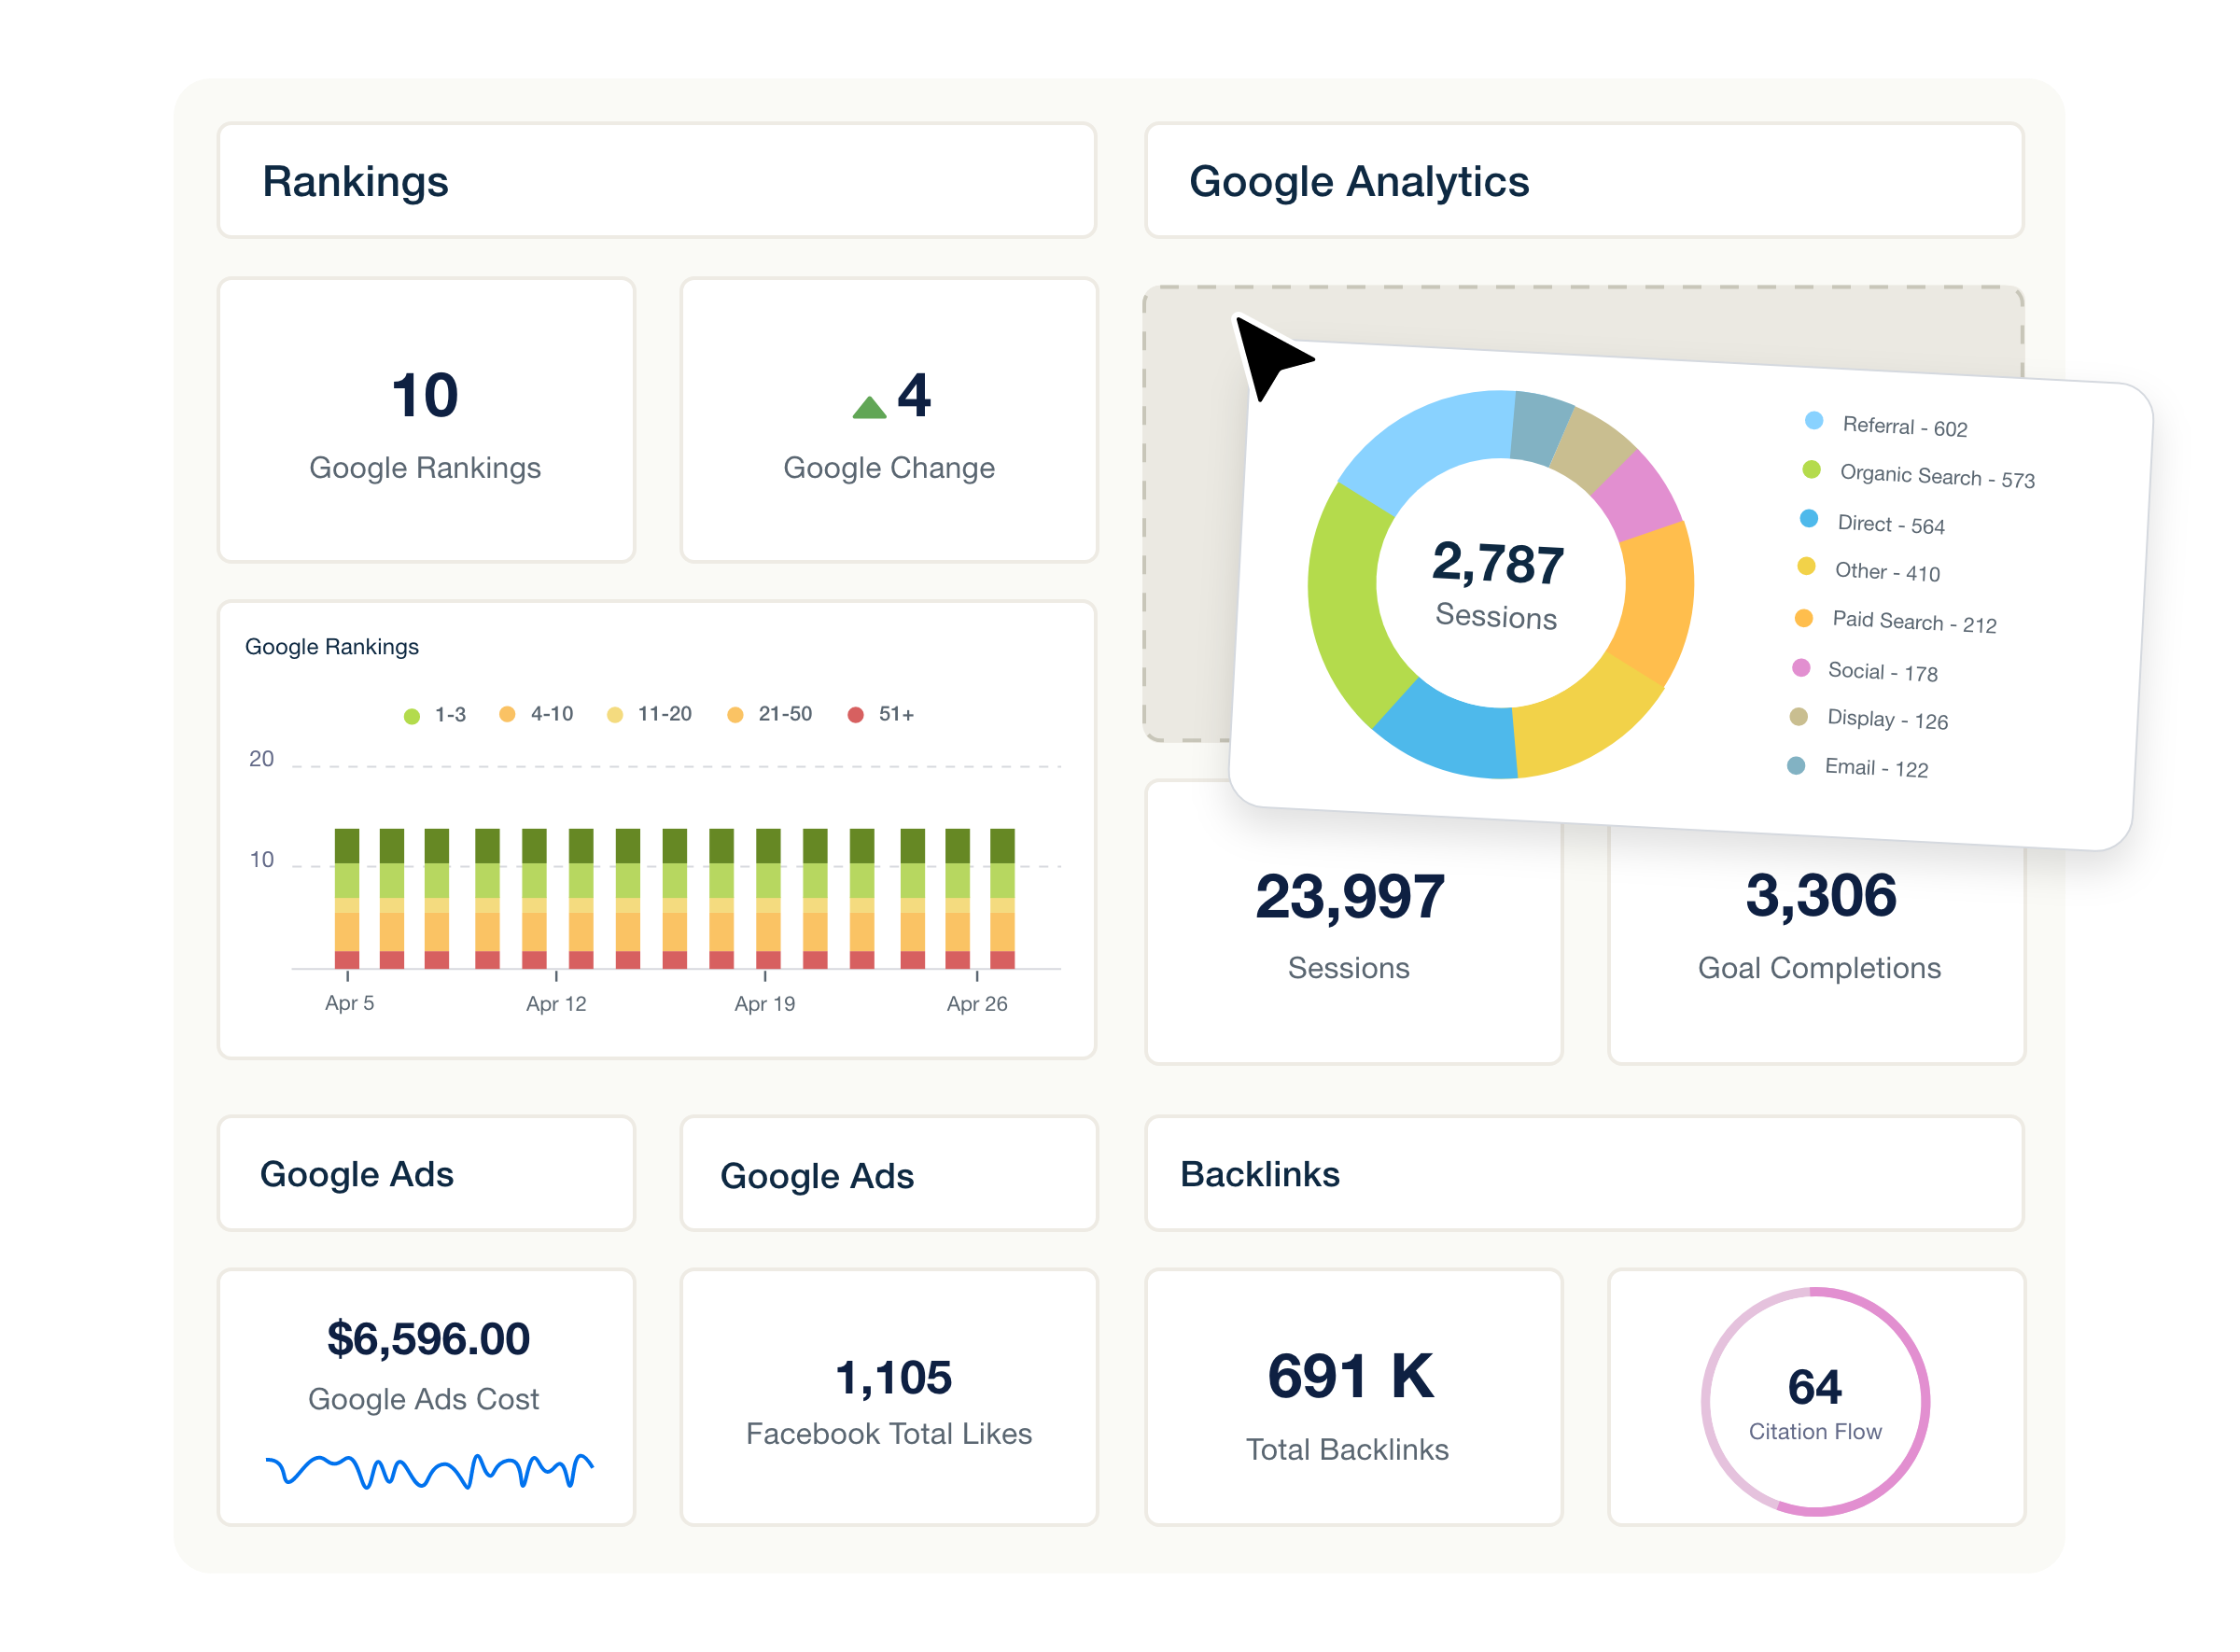
| Web Analytics | Page views, sessions, bounce rate, average session length, conversion rate, popular pages | Identify user behavior trends, site improvements, and traffic sources | |
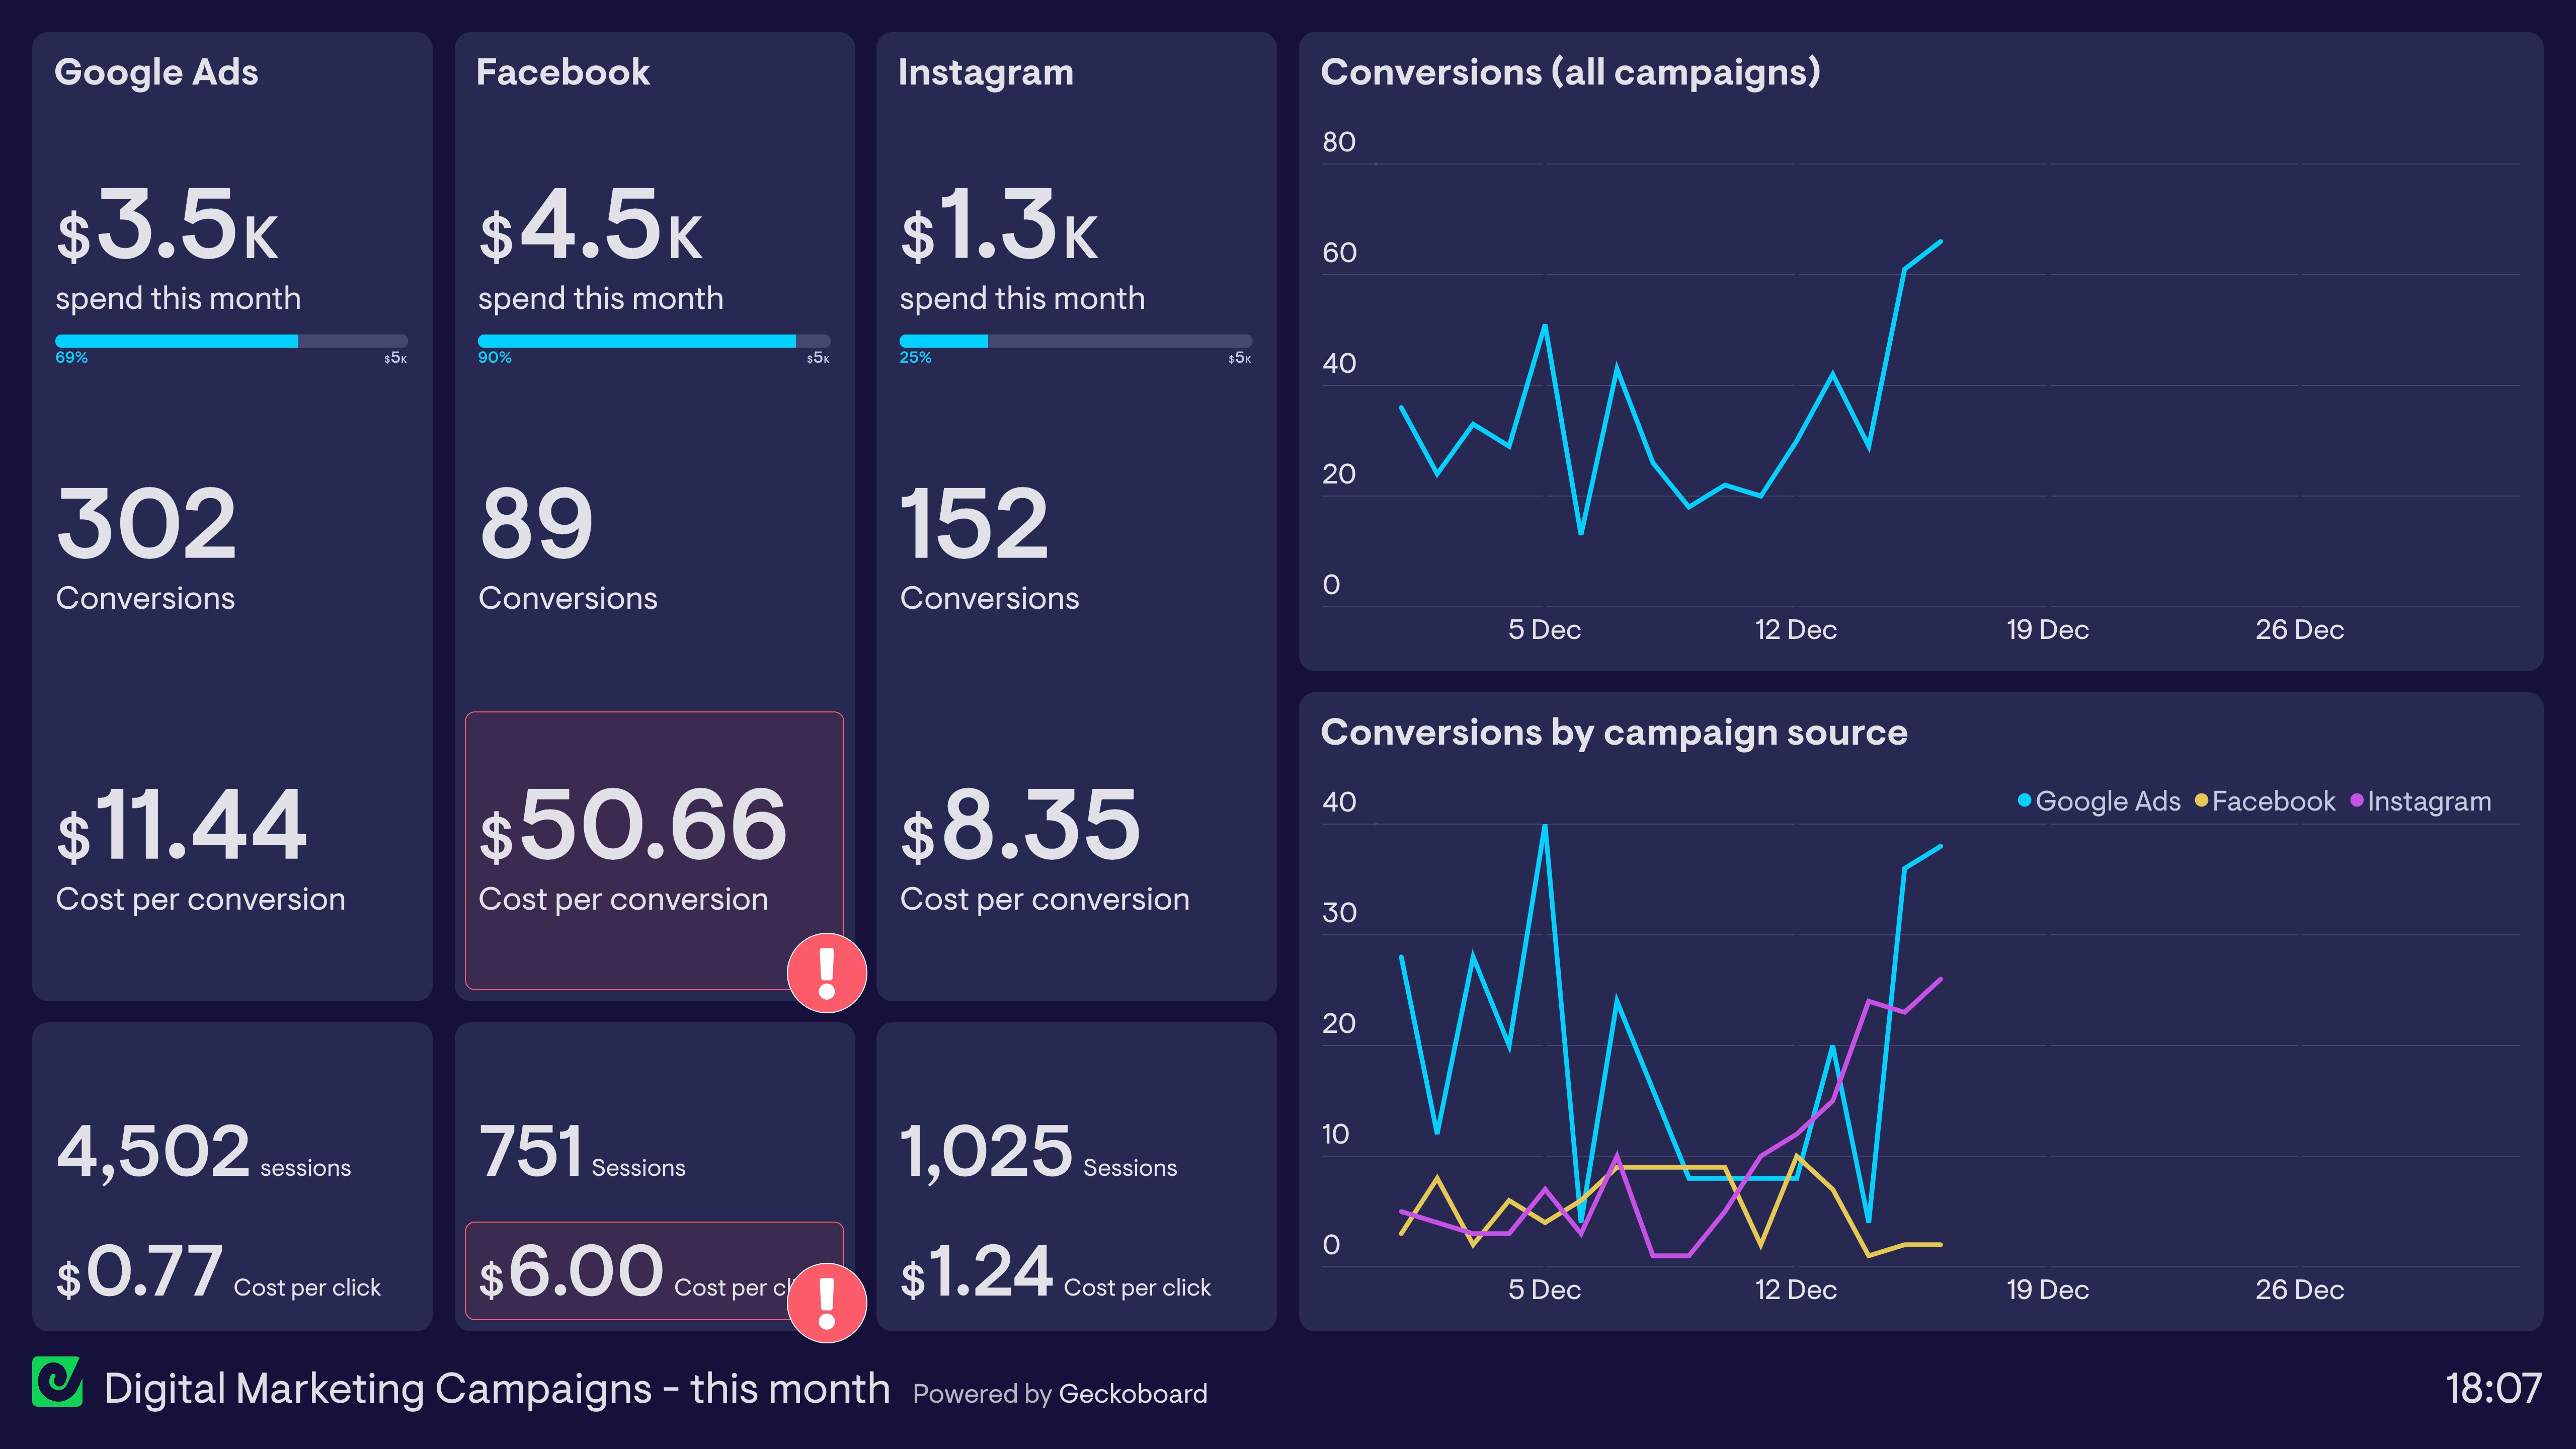
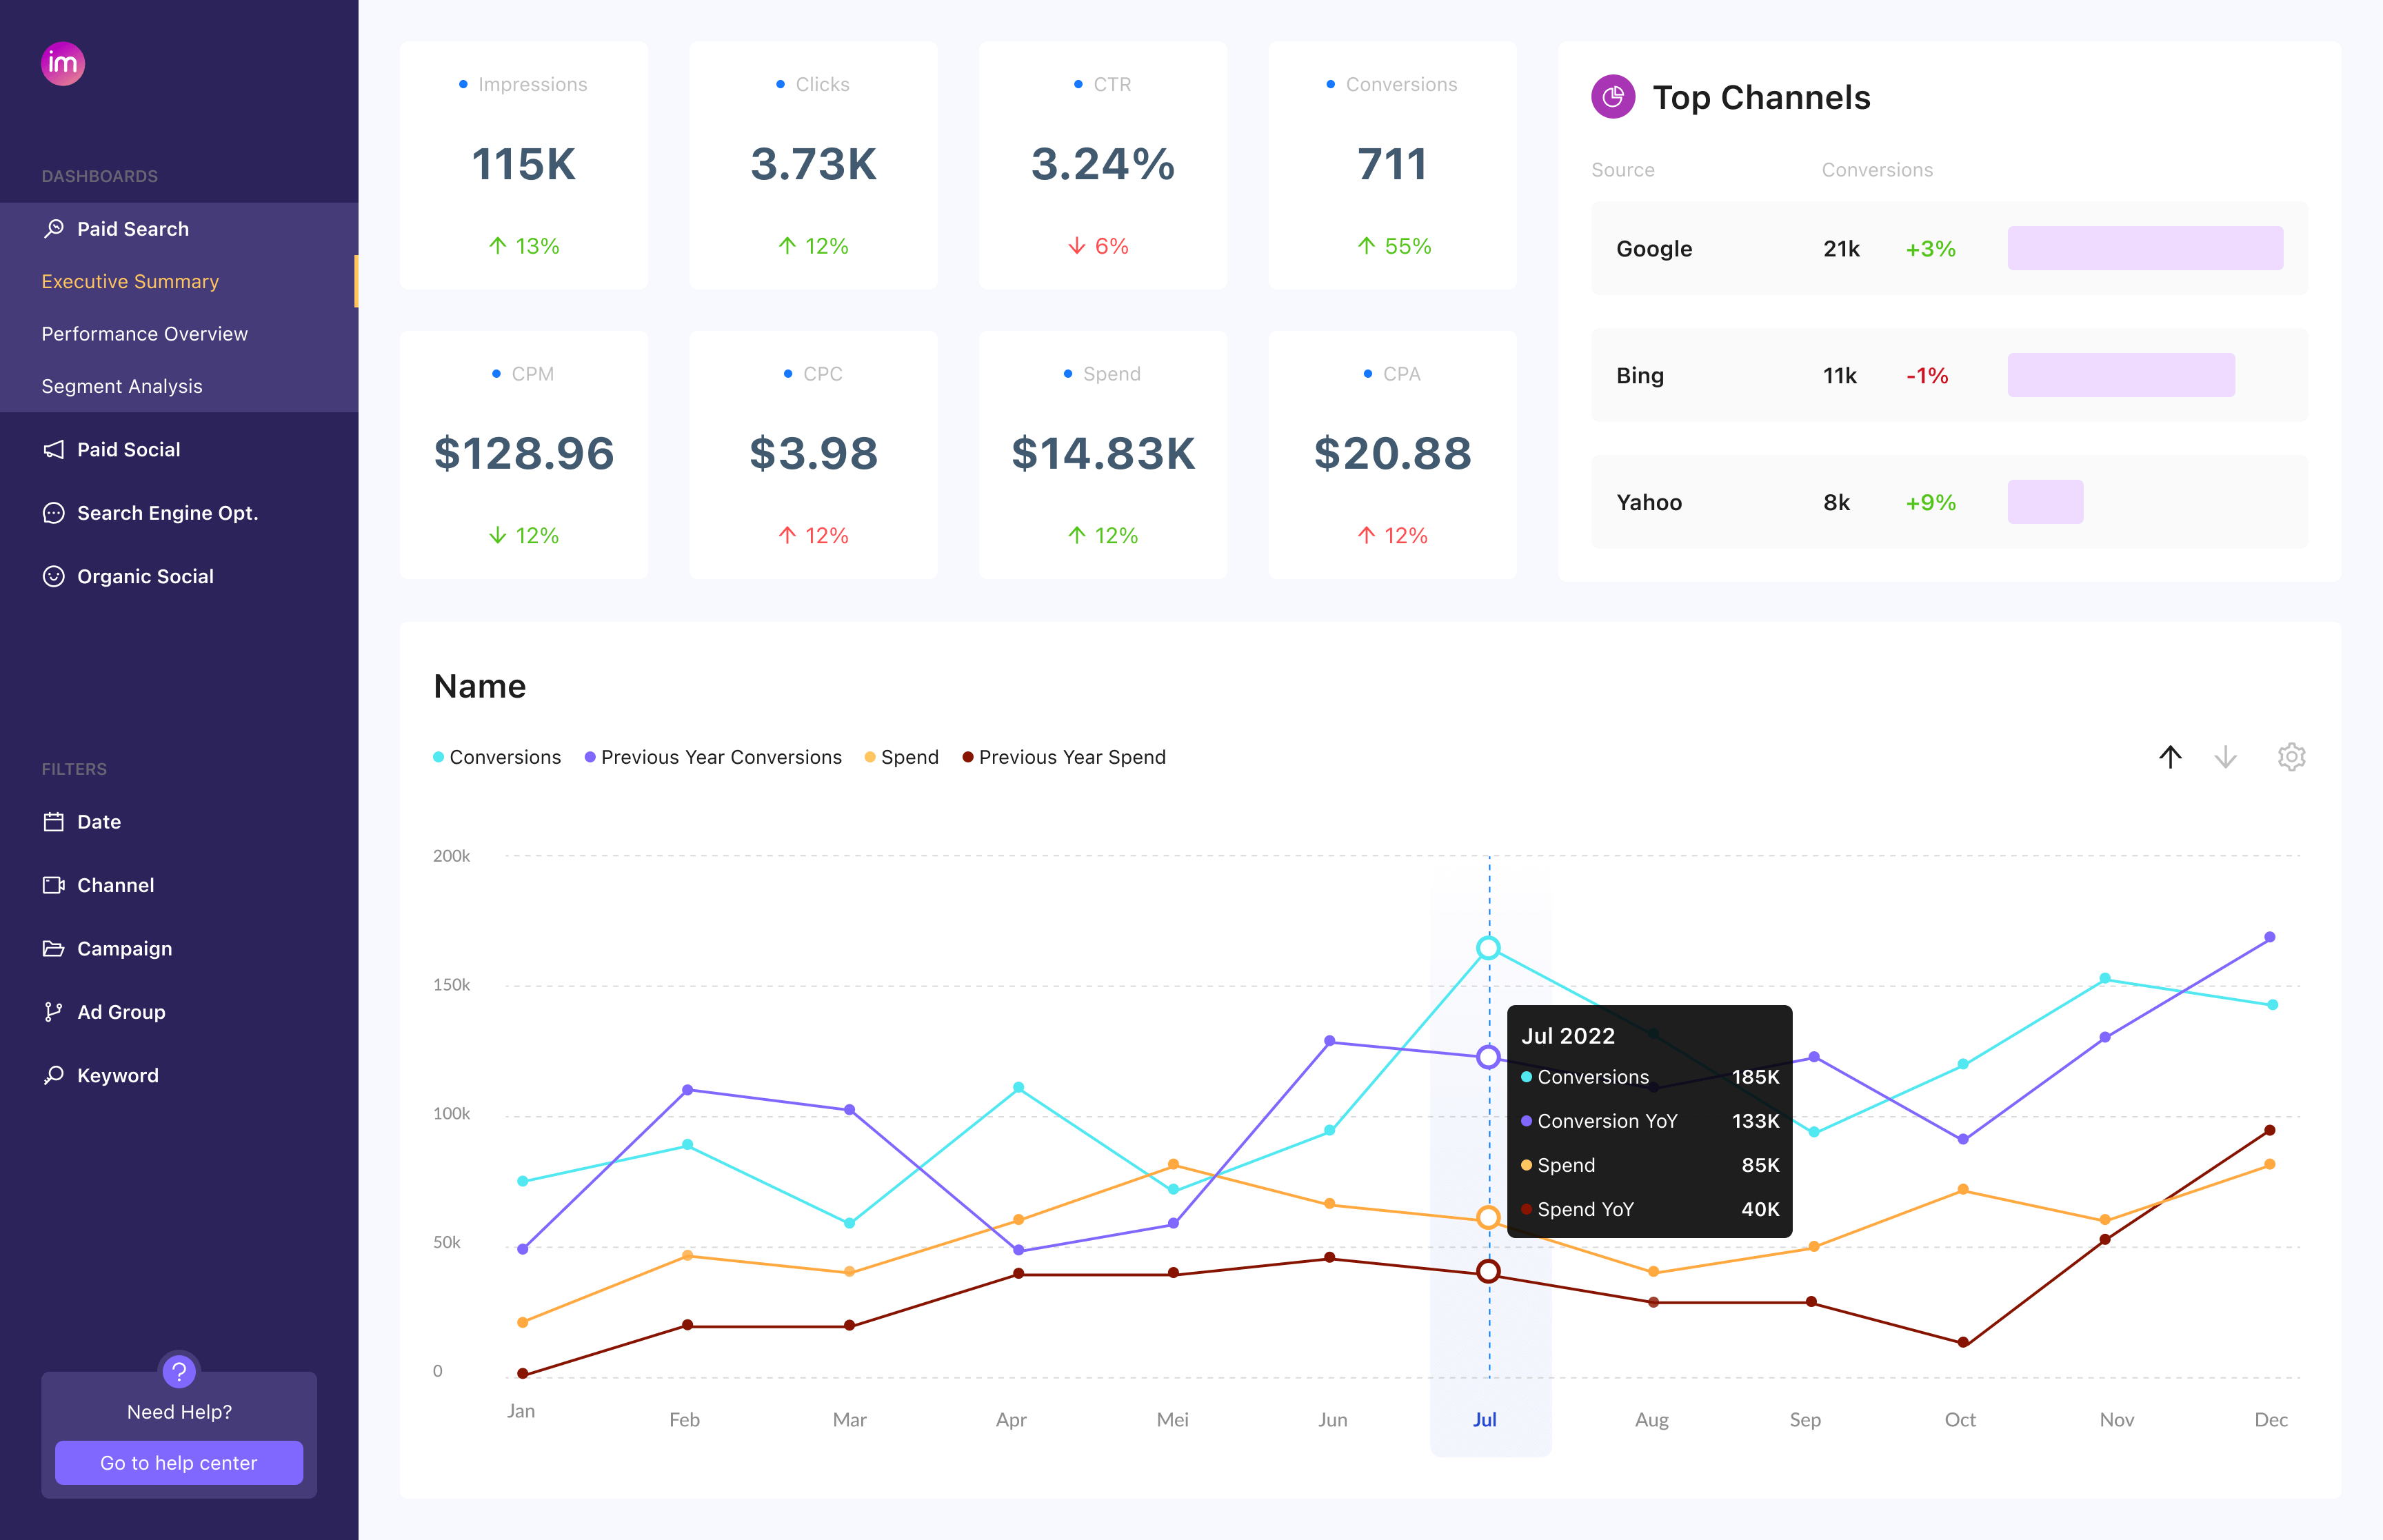
| Google Ads/PPC | Impressions, clicks, CTR, CPC, conversions, ROAS, cost per order | Compare campaign efficiency, scale winners, detect ad fatigue | |
| Social Media | Follower growth, engagement rate, organic reach, paid impressions, brand mentions | Monitor visibility, content performance, and audience response | |
| Email Marketing | Open rate, click-through rate, list growth, leads generated, conversion rate | Refine subject lines, timing, and segmentation for higher engagement | |
| SEO | Organic traffic, keyword rankings, backlinks, search visibility | Track ranking changes and content effectiveness | |
| Lead Generation/ABM | Leads by source, account engagement score, funnel progression, deal velocity | Optimize demand gen funnels and target high-value accounts | |
| Ecommerce/Sales | Sales, AOV, customer cohorts, ROAS, abandoned carts | Link marketing to revenue, analyze repeat vs. new customers |
These KPIs enable cross-channel comparison (e.g., paid vs. organic) and trend analysis over time, such as MoM growth in sessions or ROAS shifts.
Best Practices for Implementation and Optimization
- Unify Data Sources: Pull from Google Analytics, Google Ads, Meta Ads, CRM, and platforms like Shopify for a single source of truth; tools like Power BI, Klipfolio, or Amplitude automate this.
- Customize for Goals: Start with templates (e.g., 17 from Geckoboard, 14 Power BI examples) and tailor to your funnel stage—focus on top-of-funnel metrics like impressions for awareness, bottom-of-funnel like conversions for ROI.
- Visualize for Action: Use trends, heatmaps, and comparisons (e.g., channels side-by-side) to spot issues like high bounce rates or low ROAS early.
- Real-Time Monitoring: Prioritize dashboards with MoM/YoY trends and alerts for anomalies to enable quick pivots, such as reallocating ad spend.
For multi-channel optimization, a master marketing performance dashboard consolidates all KPIs to reveal attribution gaps and revenue drivers. Templates from sources like Supermetrics or Saras Analytics provide ready-to-use starting points.